How We Migrated Off Temporal Cloud at 500 Workflows/Second, Without Downtime

.avif)
Temporal is the backbone of our detection engine at Daylight, orchestrating security investigations across every customer environment. At peak, we run around 500 workflow starts per second to keep detection latency low.That scale came with tradeoffs. Our Temporal Cloud costs grew with every new tenant. In addition, workflow data, often sensitive, flowed through infrastructure outside our VPC.We decided to move to a self-hosted Temporal cluster. The challenge: do it with zero downtime, guarantee exactly-once execution, and retain the ability to roll back at any point. Here’s how we approached the migration, and what we learned along the way.
Why We Moved Off Temporal Cloud
Cost
We use Temporal's Schedules feature extensively. Every tenant we onboard brings a significant volume of data - from AWS CloudTrail to Okta to dozens of other integrations. Each new customer materially increased our Temporal Cloud bill, with schedules as the primary driver and no clear way to optimize them. Temporal Cloud pricing scales with workflow executions, so high-frequency schedules directly translate into higher costs.
To keep our Mean Time to Detect (MTTD) and Mean Time to Respond (MTTR) best-in-class, we run workflows at high frequency - anywhere from every 10 seconds to every minute. At peak, we're executing roughly 500 workflow starts per second. That adds up quickly on a managed platform.
Security
Running a security platform means our workflows process sensitive customer data. With Temporal Cloud, workflow inputs, outputs, and state transitions traverse external infrastructure. By self-hosting, we keep Temporal entirely within our VPC - no workflow data leaves our network boundary. This simplified our security posture and made customer security reviews more straightforward.
Understanding Temporal's Architecture
Before diving into the migration, it helps to understand what you're actually deploying. Temporal Server consists of four main services, each with distinct responsibilities:
Frontend Service
The Frontend is the gateway to your Temporal cluster. It handles all client requests - starting workflows, querying state, sending signals - and routes them to the appropriate internal services. It also performs rate limiting, authentication, and authorization. When sizing, remember that every SDK connection and API call hits Frontend first.
History Service
This is the brain of Temporal. The History service maintains the state of all workflow executions, processes events, and makes decisions about what should happen next. It's responsible for the durable execution guarantees that make Temporal valuable. History is the most resource - intensive service and typically your scaling bottleneck. Workflow state is distributed across history shards, and each shard is owned by exactly one History pod at a time - this is why shard count matters for parallelism.
Matching Service
Matching is the task dispatcher. When a workflow needs work done, History creates a task. Matching maintains task queues and dispatches these tasks to polling Workers. If you see high workflow_task_schedule_to_start_latency, Matching (or your Workers) might be struggling to keep up.
Worker Service (Internal)
Not to be confused with your application Workers that run workflow code - this is Temporal's internal Worker service. It handles system workflows like archival, replication, and batch operations. It's the least resource - intensive component but still essential for cluster health.
Supporting Infrastructure
Beyond the core services, a production Temporal deployment needs:
- Persistence store - A database (PostgreSQL, MySQL, or Cassandra) that stores workflow state and task queues
- Visibility store - For advanced workflow queries and search. Can use the same database or a dedicated backend. We use AWS OpenSearch.
- Temporal UI - Optional but highly recommended web interface for debugging and monitoring workflows
Understanding these components helped us make better infrastructure decisions and know where to look when things went wrong.
Building Our Self-Hosted Temporal Cluster
The good news? Our Platform team had prior experience running self-hosted Temporal clusters. We knew what we were getting into.
Research Phase
We started by studying Temporal's official guidance on self - hosting at scale. The production readiness checklist became our bible. We mapped out the critical components and identified the metrics we'd need to monitor from day one.
Infrastructure Decisions
Database: Aurora PostgreSQL with I/O - Optimized
While Temporal supports both Cassandra and SQL databases, we chose Aurora PostgreSQL for several reasons:
- Faster failover - approximately 30 seconds vs. minutes with self - managed Cassandra
- Simpler operations - our team already has deep PostgreSQL expertise
- I/O - Optimized pricing - predictable costs for Temporal's write - heavy workload without surprise IOPS bills
Advanced Visibility: OpenSearch
For workflow search and visibility, we deployed OpenSearch. This gives us the ability to query workflows by custom attributes - essential when debugging issues across hundreds of tenants.
Helm Chart Configuration
We used Temporal's official Helm chart as our base, customizing it for our production requirements. Here are the key configurations:
Resource Limits and Requests
Based on Temporal's recommendations and our load testing:
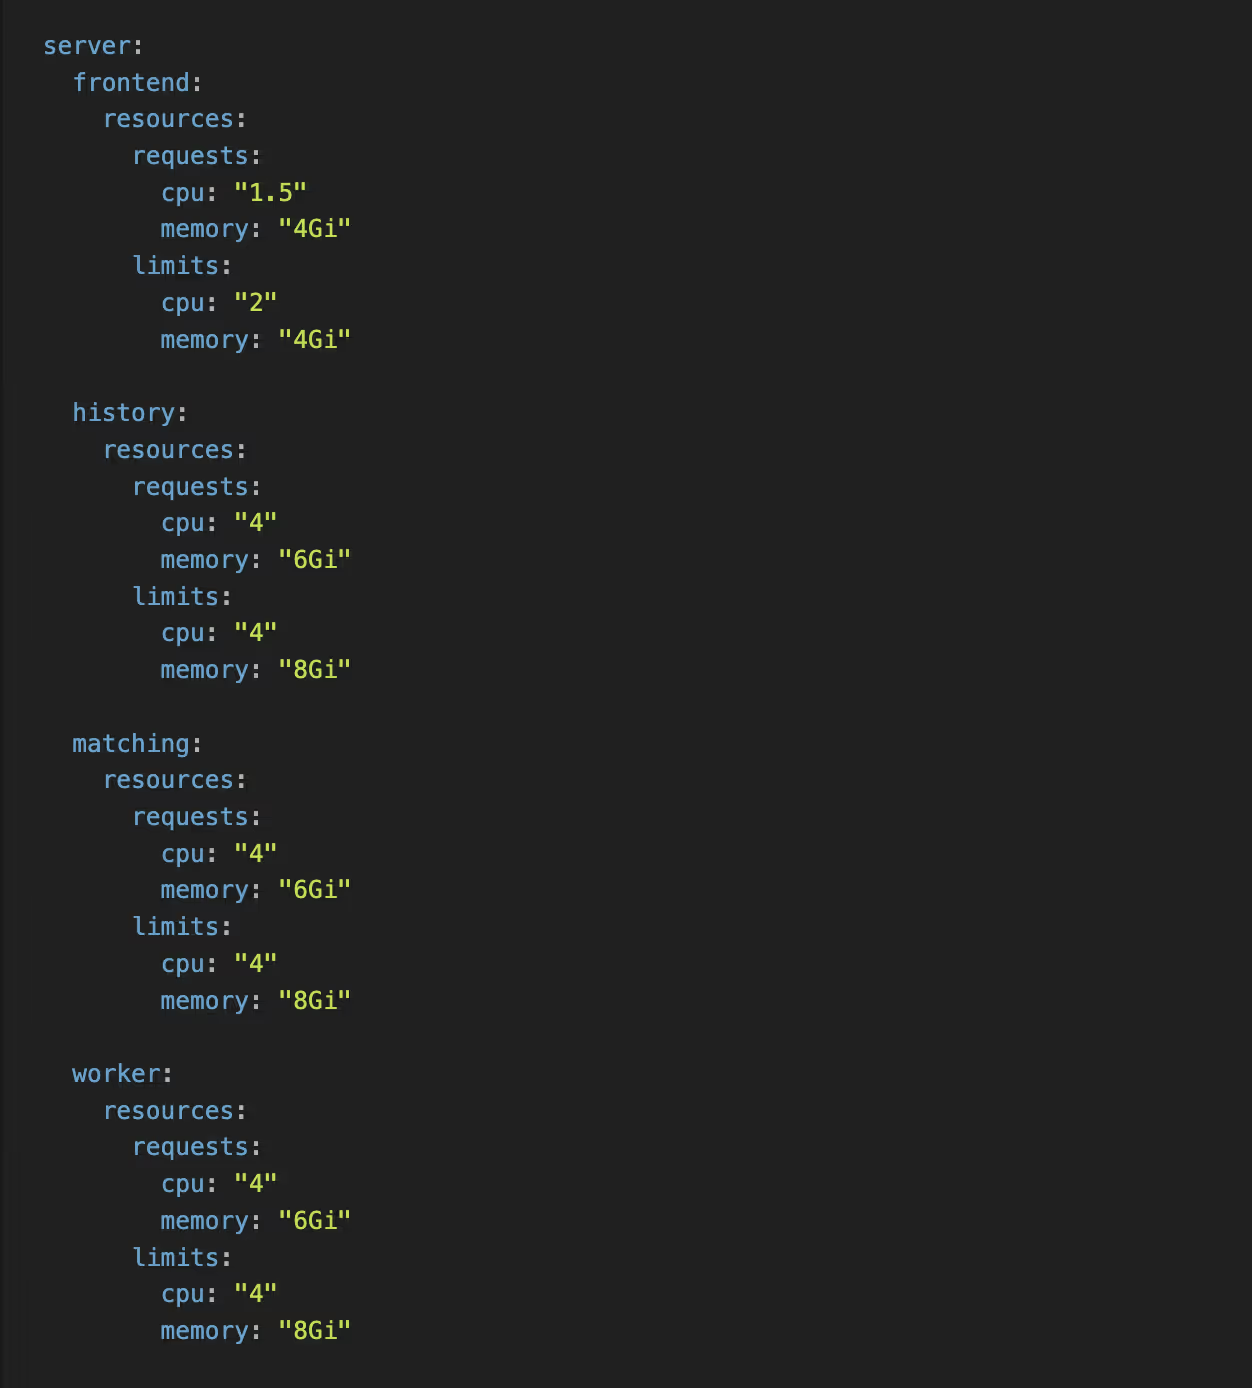
Setting requests equal to (or close to) limits helps Kubernetes make better scheduling decisions and prevents noisy neighbor issues.
Pod Anti - Affinity Rules
To ensure high availability, we spread pods across availability zones:

We applied similar rules to History, Matching, and Worker services. The requiredDuringSchedulingIgnoredDuringExecution ensures Kubernetes won't schedule two pods of the same service in the same AZ - if it can't satisfy this constraint, the pod stays pending rather than compromising availability.
History Shards
For history shards, we configured 2048 - this provides headroom for growth and helps distribute load across the History service replicas.
Warning: Shard count is effectively immutable after cluster creation. You cannot change it without migrating to a new cluster. Choose carefully and err on the side of more shards if you expect growth.

Additional Production Settings
- Pod Disruption Budgets (PDBs) - ensures rolling updates don't cause outages
- External secrets integration - for database credentials via AWS Secrets Manager
- Datadog annotations - for metrics and log collection
- SSO integration - for the Temporal UI access control
The Migration Strategy
This was the tricky part. Our requirements:
- Exactly - once execution - investigations must not run on both clusters simultaneously
- Zero downtime - no impact on MTTD/MTTR during migration
- Per - tenant control - ability to migrate individual tenants and monitor impact
- Rollback capability - revert any tenant back to Temporal Cloud if needed
Dual - Client Architecture
We implemented a dual - client pattern in our common library. The key change was adding a SelfHostedTemporal configuration alongside our existing Temporal Cloud client:

Services can now instantiate both clients:
NewClient()- connects to Temporal Cloud (with API key + TLS)NewSelfHostedClient()- connects to self - hosted (no auth required internally)
The self - hosted client connection is controlled by a feature flag at the infrastructure level. This was necessary because we didn't deploy self - hosted Temporal to all environments at once - the flag ensures services don't attempt to connect to a cluster that doesn't exist yet.
Per - Tenant Routing: On - Demand Workflows
For on - demand workflows (triggered by API calls or events), routing is straightforward. A feature flag per tenant determines which Temporal cluster executes the workflow. This gave us:
- Gradual rollout - start with internal tenants, then expand
- Instant rollback - flip the flag to route back to Temporal Cloud
- A/B comparison - run the same workflow type on both clusters to validate behavior
Per - Tenant Routing: Schedules
Schedules were more complicated. Unlike on - demand workflows where you can simply route to a different cluster, schedules are persistent objects that live in Temporal. We needed to ensure a schedule wasn't running in both places simultaneously.
Our solution had three components:
1. Dual - Writer for Schedule Creation/Updates
When a schedule is created or updated, we write it to both Temporal Cloud and self - hosted. The schedule is created in a paused state on the target cluster until we're ready to migrate that tenant.
2. Schedule Copy API
We built an API to copy schedules from one Temporal cluster to another - in both directions. This can be controlled per tenant, allowing us to:
- Migrate a tenant's schedules to self - hosted
- Roll back a tenant's schedules to Temporal Cloud if issues arise
3. Pause/Unpause API with Safety Mechanism
The critical piece: an API to pause and unpause schedules on each cluster, with a built - in safety mechanism that prevents unpausing a schedule if it's already unpaused on the other cluster. This guarantees exactly - once execution - a schedule can only be active in one place at a time.
The migration flow for each tenant's schedules:
- Schedules already exist on both clusters (dual - write)
- Pause schedules on Temporal Cloud
- Unpause schedules on self - hosted (safety check passes)
- Monitor for issues
- If rollback needed: pause on self - hosted, unpause on Cloud
The Rollout
We followed a phased approach:
- Staging - Full deployment with synthetic load testing
- Internal tenant - We migrated our own e2e production tenant first, giving us confidence before touching customer workloads
- Production tenants - Gradual rollout, one tenant at a time, with monitoring between each migration
Each phase included a bake period where we monitored metrics before migrating additional tenants.
Monitoring: What to Watch
Temporal Server Metrics
Aurora PostgreSQL Metrics
For tooling, we use Datadog with custom dashboards, though Grafana with Prometheus is equally viable if you prefer open-source.
Performance Tuning Tips
The io:XactSync wait event is the likely bottleneck for Temporal's write - heavy workload (frequent commits per state transition). Consider:
- Setting
synchronous_commit = remote_writeif you can tolerate slightly relaxed durability - Tuning
commit_delayandcommit_siblingsfor write batching
War Story: The Mysterious "Slow gRPC Call" Error
A few weeks after migration, we started seeing intermittent Slow gRPC call warnings in our Temporal server logs. Workflows would occasionally hang, and our persistence_latency metrics showed periodic spikes. The frustrating part? It wasn't consistent - everything would be fine for hours, then suddenly degrade.
The culprit: database connection pool starvation.
Our initial Aurora instance and Temporal persistence configuration worked fine during testing, but under real production load with hundreds of concurrent workflows, we were exhausting the connection pool. When Temporal couldn't acquire a database connection, gRPC calls backed up waiting for persistence operations to complete.
The fix was multi-pronged:
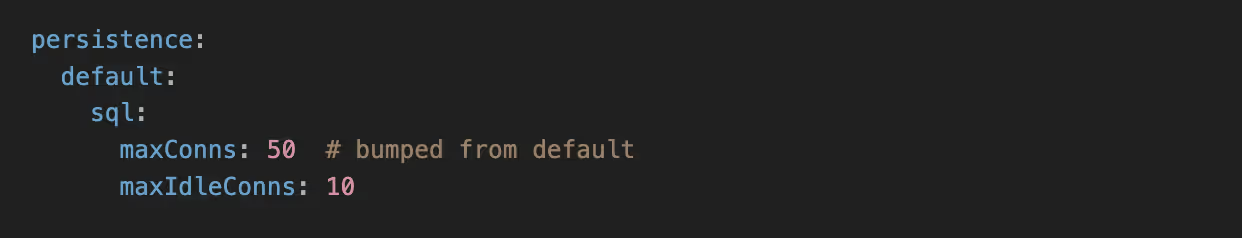
- Increased
maxConnsin Temporal's persistence configuration - the default was too conservative for our throughput - Scaled to a larger Aurora instance class - more headroom for
max_connections - Added connection pool metrics to our dashboards - now we monitor pool utilization and get alerted before saturation
If you see Slow gRPC call in your Temporal logs, check your connection pool metrics immediately. It's easy to overlook during initial sizing.
Lessons Learned
- Start with more capacity than you think you need. Temporal workloads are spiky. It's easier to scale down after stabilization than to firefight during migration.
- History shards are set at cluster creation. Choose wisely. 2048 shards works well for high-throughput clusters.
- The dual-client pattern is worth the complexity. Being able to route individual tenants gave us confidence to migrate gradually.
- Monitor persistence latency religiously. When the database slows down, everything slows down. This is your early warning system.
- Don't rush with the rollout. caught several configuration issues in staging and internal E2E tenants that would have caused production incidents.
Was It Worth It?
Absolutely. Our Temporal costs are now predictable and significantly lower. We have full control over our cluster configuration, workflow data stays within our network, and we aren't constrained by managed service limitations.
The migration took focused effort over several months, but the dual - client architecture made the actual cutover anticlimactic - exactly how infrastructure migrations should be.
Acknowledgments
A huge thank you to the Temporal community. The Temporal Slack channel is one of the most helpful and vibrant communities we've encountered. Whether it was debugging obscure configuration issues, understanding shard behavior, or validating our architecture decisions - someone in that Slack had been there before and was willing to help. Self - hosting a critical piece of infrastructure is significantly less daunting when you have that kind of support backing you up.
Interested in building AI-native security engineering at the highest scales? We're hiring at Daylight Security.
Reach out if this resonates with how you want to build software.